Viewing your server resource usage could be benefitial from a performance standpoint. This could also help you identify potential security issues, related to higher resource usage or spikes.
To view your resource usage, you will first have to log in to your Gate.com Server Manager portal. For instuctions on how to access it, please refer to the following article: How Do I Access my Gate.com Server Manager?
Once logged in, navigate to the "Advanced Monitoring" section. This will open your Grafana Monitoring app.
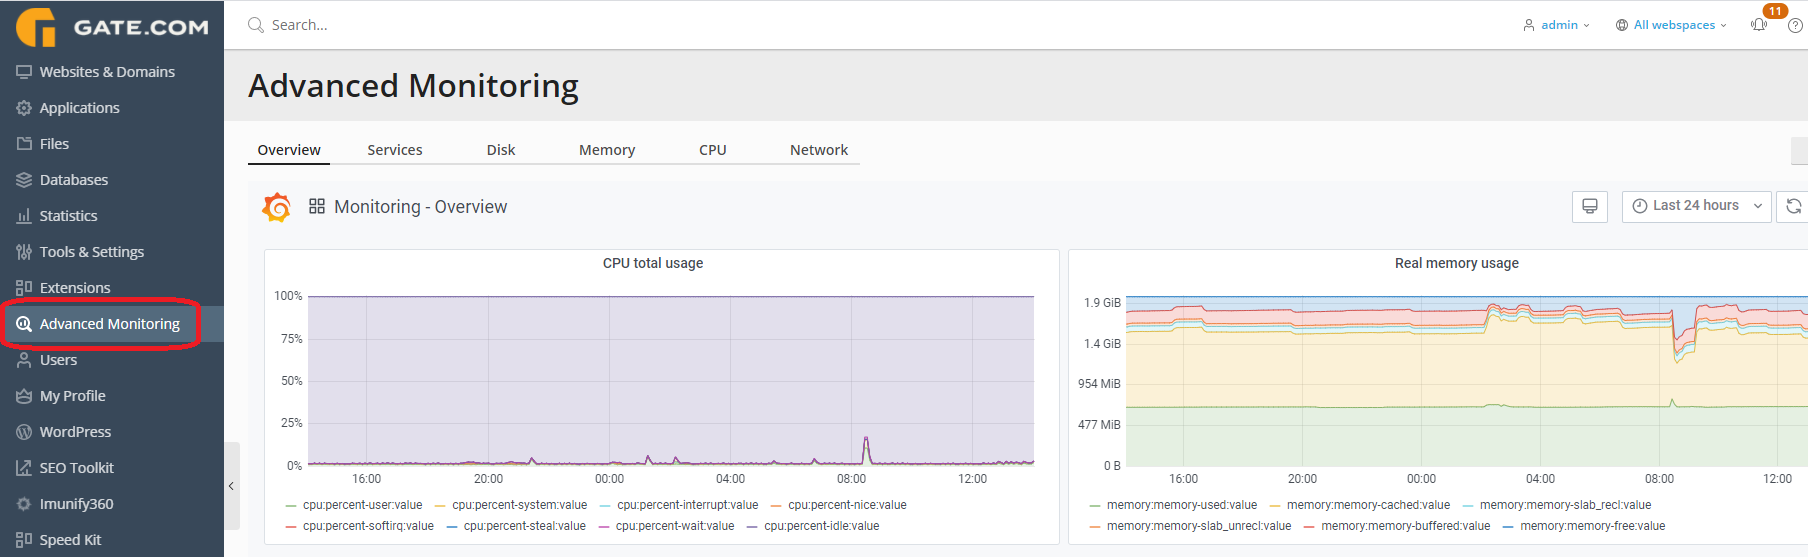
Overview: This section of the app provides an overview of the CPU and Memory usage of your Virtual Machine for the last 24 hours refreshed every 2 minutes. Keep in mind that the time range and refresh frequency can be customized.
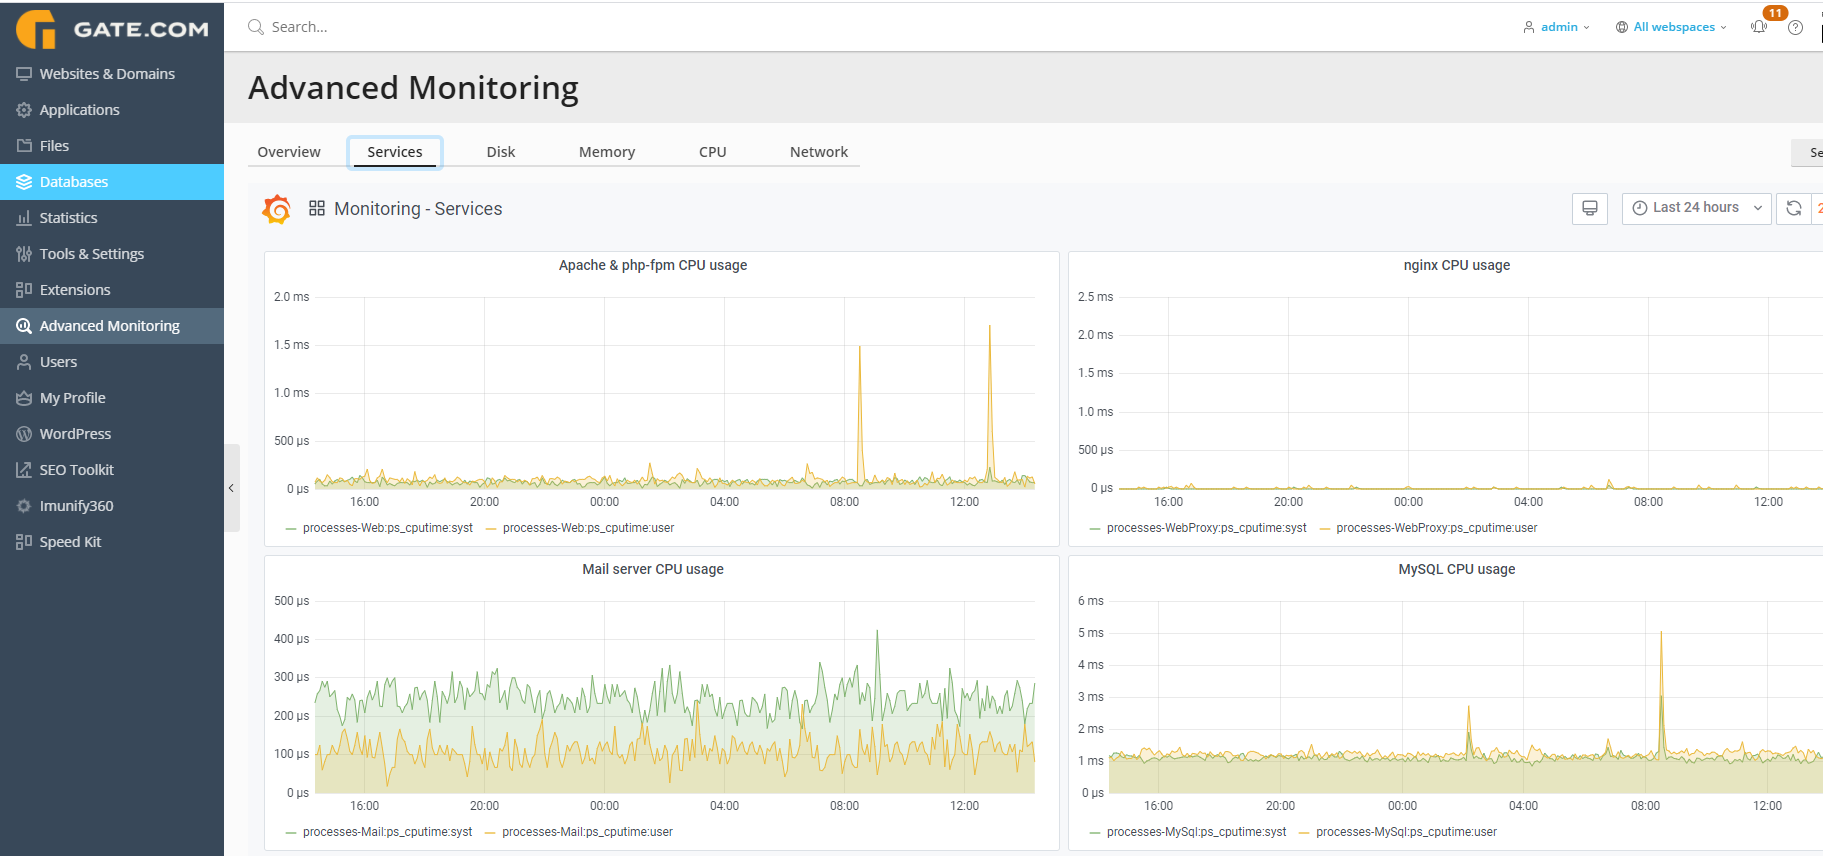
Services: This tab provides information on the services such as NginX, MySQL, Mail which are running on your server and their respective resource usage.
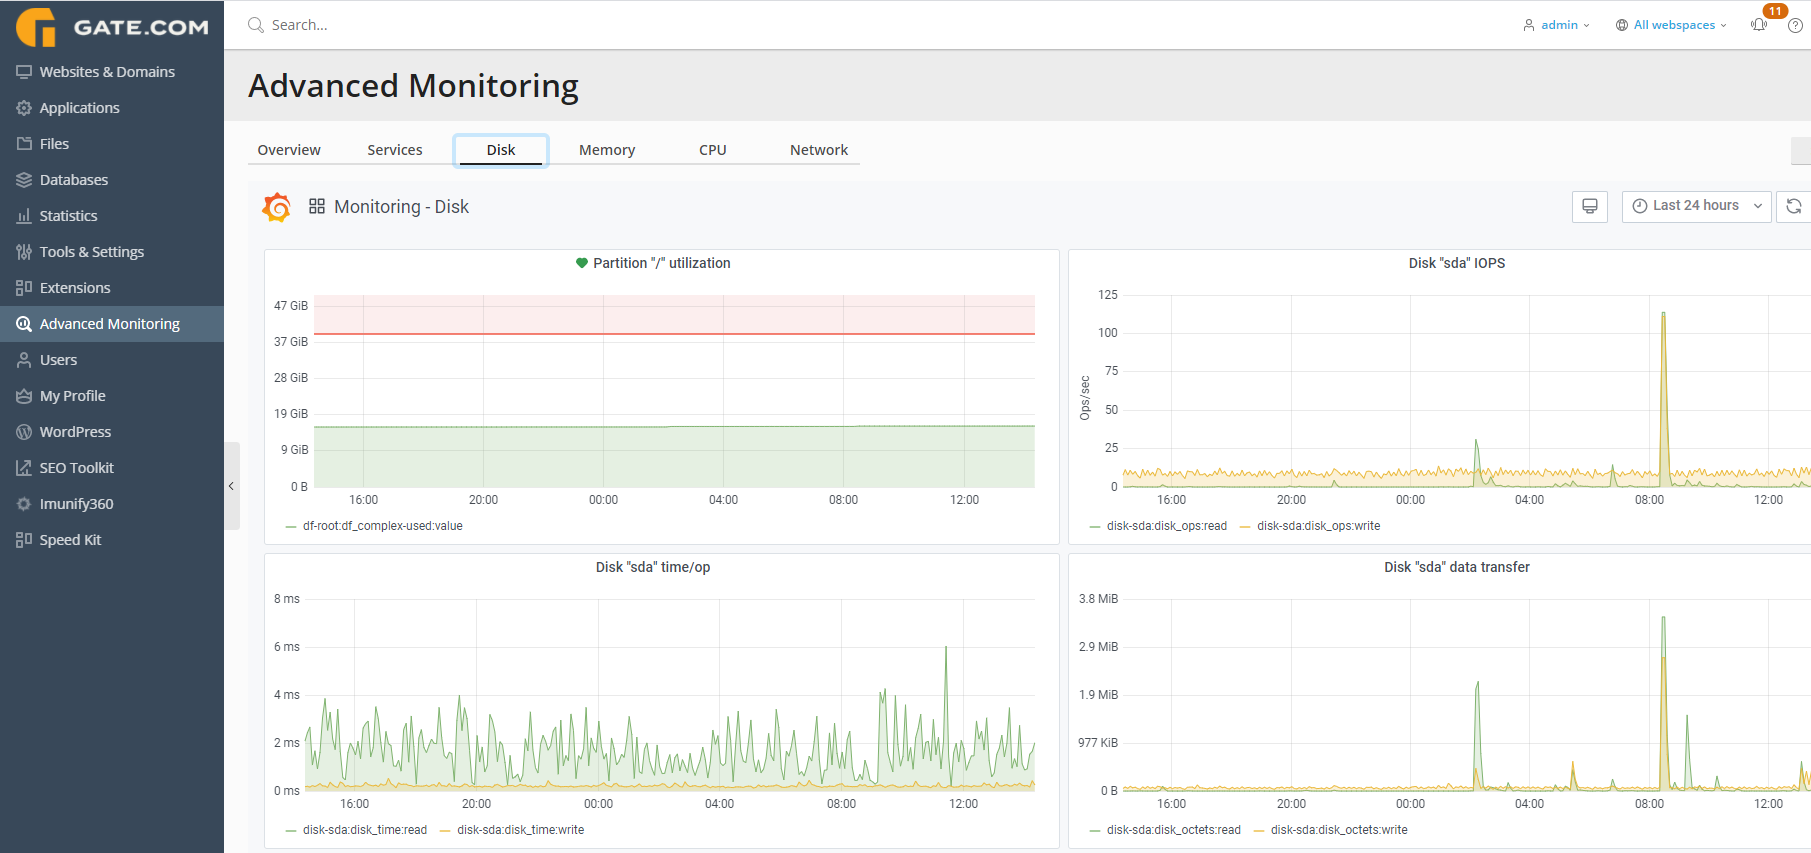
Disk: From this section, you can view your storage utilization as well as data transfer information.
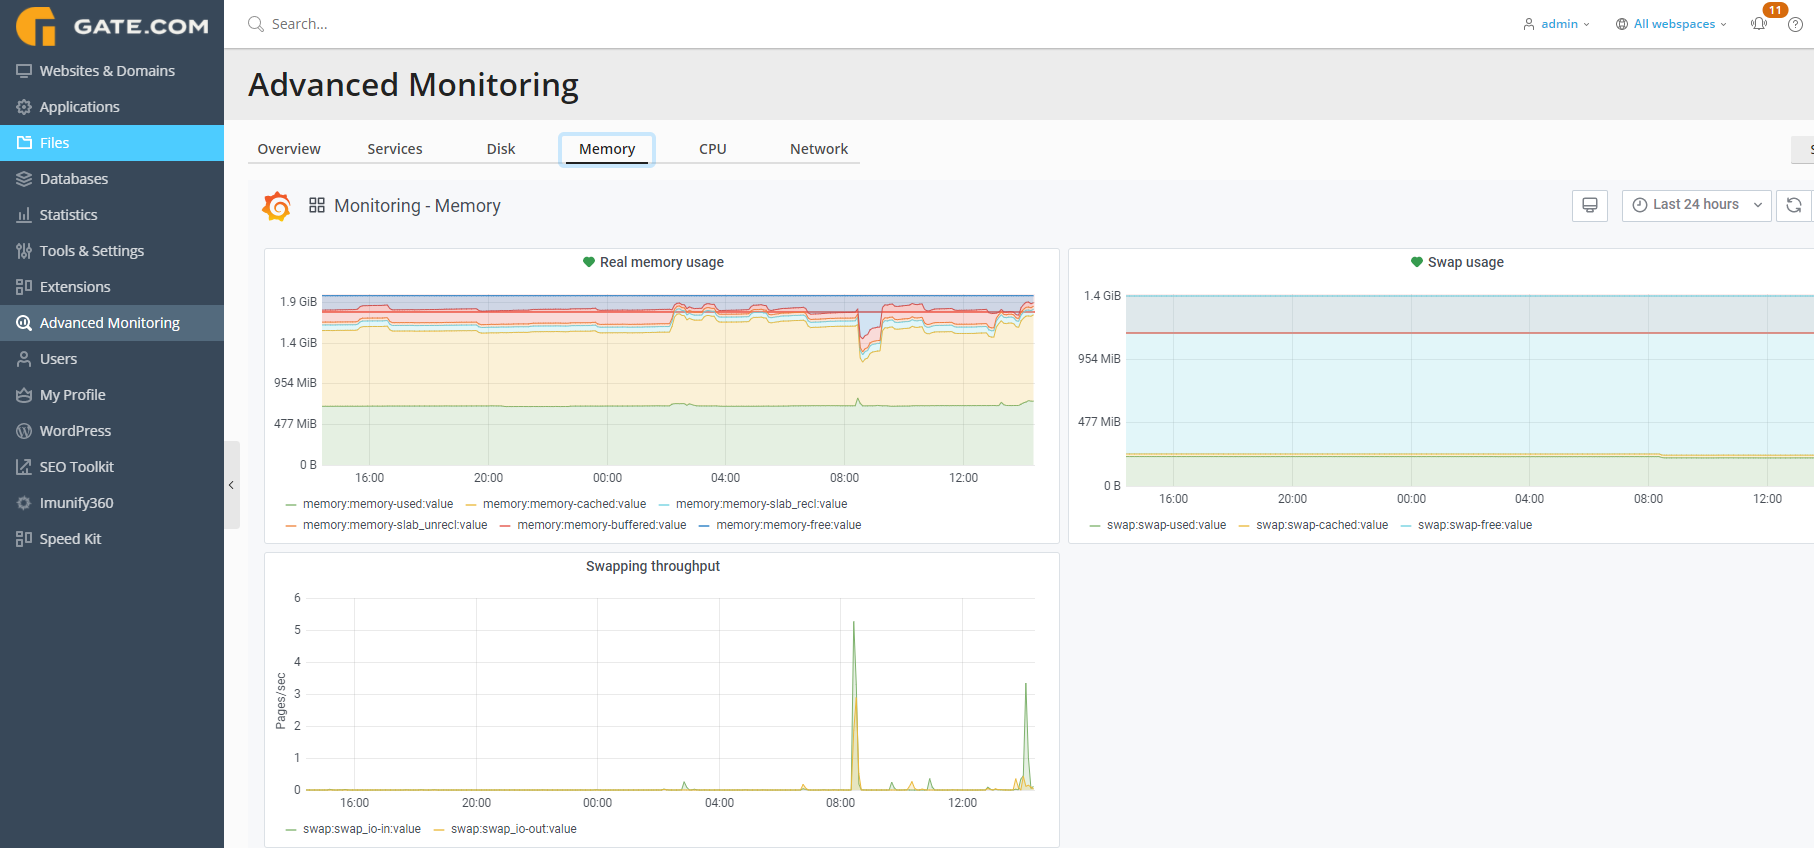
Memory: Specifics on your RAM usage.
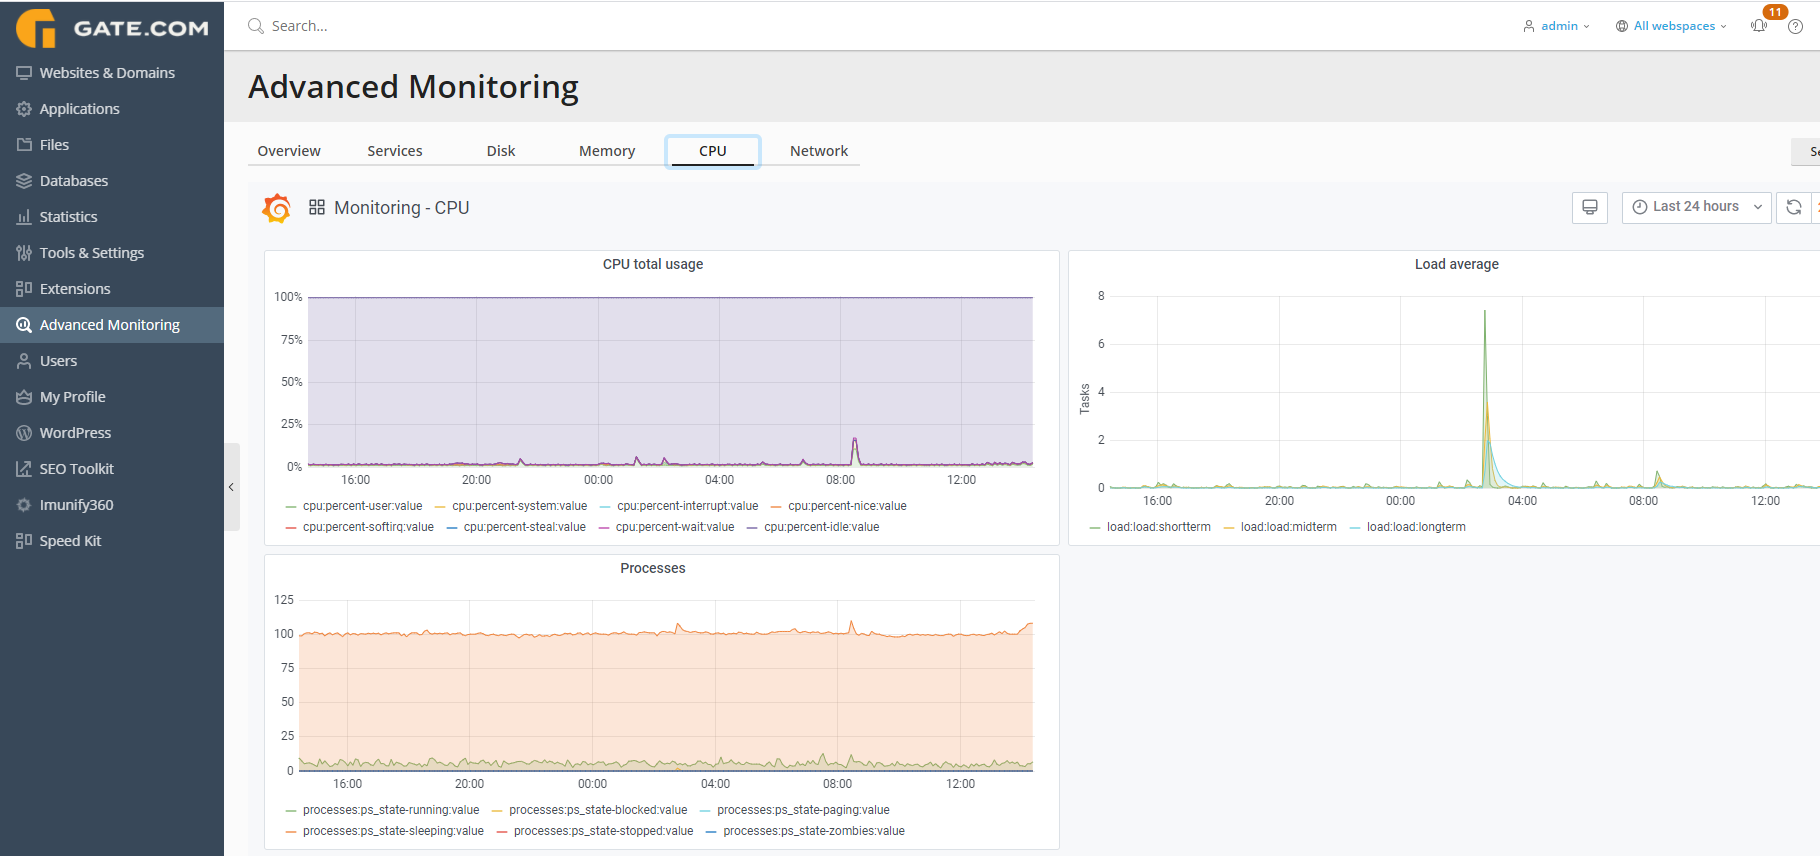
CPU: Specifics on your CPU usage.
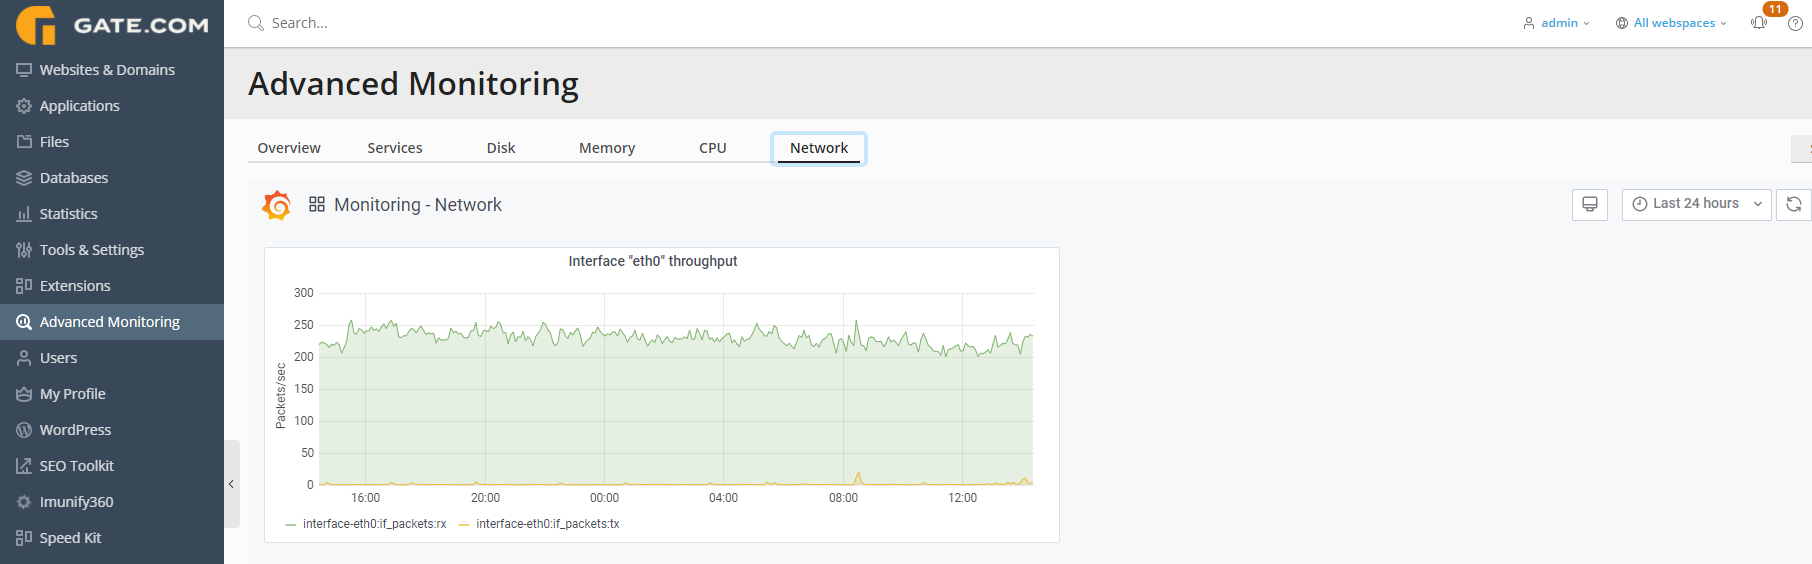
Network: Information on your server's network usage
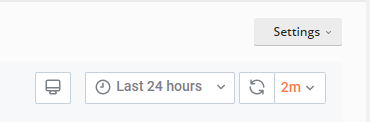
Note: As with the Overview tab, each of these sections are customizable in terms of time range and refresh frequency. You may edit these values from each respective section as shown below: